

Robust KPI reporting and dashboards are essential for gaining visibility into inventory turnover, order cycle?time, and labour efficiency to drive cost savings and compliance. Warehouse and 3PL professionals often face challenges such as inaccurate analytics that hide shrinkage, benchmarking gaps in throughput, and forecasting errors that inflate carrying costs and hinder turnover. At Clarus WMS, teams work with real?time dashboards that integrate exception reporting, enabling faster performance monitoring and labour optimisation.
Traditionally, compiling KPI reports involved manual spreadsheets and sporadic checks, which could take weeks to reveal issues with accuracy or shrinkage, often resulting in outdated data. Moving to automated analytics with synchronised dashboards reduces the time to insight, improves data quality at the source, and cuts the labour required for reconciliation and forecasting.
The result of traditional methods:
- Delays in decision?making because visibility is poor and KPIs are compiled manually
- Inefficiencies in labour tracking that allow shrinkage and cost overruns to go unchecked
- Lost revenue from forecasting inaccuracies and non?optimised inventory turnover
This article breaks down the failures of outdated KPI reporting methods and explores how modern, cloud?based dashboards improve analytics and exception management. Where helpful, we add practitioner commentary drawn from an internal interview to ground the guidance in day?to?day warehouse realities.
What is KPI Reporting and How Do I Optimise It?
KPI reporting tracks metrics such as throughput, accuracy, and shrinkage to monitor warehouse performance and support decisions about inventory and labour. Optimising KPI reporting means automating data capture at the point of work, standardising definitions, and surfacing exceptions in near real time so leaders can act before service levels slip. In practical terms, this includes clear throughput definitions, consistent cycle counting, and exception alerts tuned to the business.
Expert insight: Clarus surfaces activity through live transactional grids that show what is happening now and what has happened in the past, tied to who did the work and when, which provides the raw counts for KPI calculation.
Do I Need Dashboards for My Warehouse Operations?
Dashboards are essential as soon as order profiles or client requirements become complex. They provide shared, real?time views of KPIs like inventory accuracy, order cycle?time, and shrinkage so teams can manage exceptions, uphold SLAs, and coordinate across shifts or sites. For small, stable operations, spreadsheets may suffice. However, as volumes fluctuate, the overhead and error risk of manual methods increase significantly.
Expert insight: “The data is there to support how you manage your labour,” but without a dedicated labour module, managers typically blend WMS task data with shift calendars in BI tools to gauge efficiency.
Digital adoption is now mainstream. The 2024 report from MHI underscores that analytics and cloud capabilities are central to daily operations, see 2024 MHI Annual Industry Report, The Collaborative Supply Chain.
How Does Visibility Impact Inventory Analytics?
Visibility improves inventory analytics by making core signals, for example receipts, putaways, picks, adjustments, and movements, available as they occur. This enables tighter control of inventory accuracy and shrinkage, and it reduces the latency between issue and action.
Two practical enablers repeatedly emerge in research: reliable data capture and fast feedback loops. For discussion of digitalisation, accuracy, and real?time adjustments in automated and semi?automated facilities, see MIT CTL, The Warehouse of the Future.
What Role Does Forecasting Play in Cost Efficiency?
Forecasting determines labour, transport, and inventory decisions, so accuracy directly affects cost.
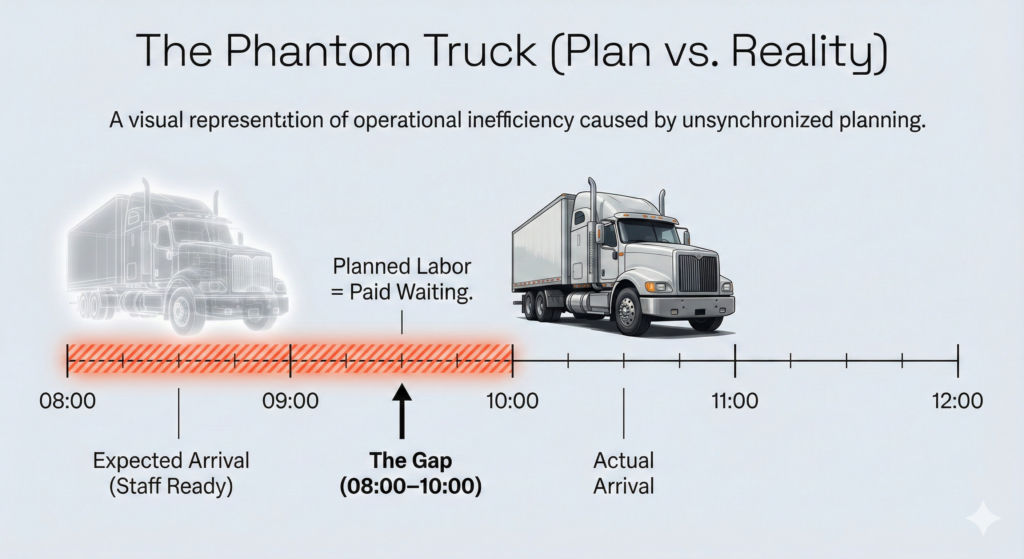
Expert insight: Forecasting is hardest for 3PLs that do not control inbound and outbound timing. Expected arrivals may slip, which means paid staff stand waiting. Comparing expected versus actual dates in the WMS is vital for learning and for future planning.
Traditional Methods vs. Clarus WMS for Reporting
Spreadsheet?led reporting often fails at scale because it depends on manual data entry, local macros, and specialist knowledge that does not transfer well across teams. Decades of spreadsheet research show typical cell error rates in the 1% to 5% range, and audits of large spreadsheets frequently uncover material errors, which undermines KPI trust and slows decisions. For a review, see Panko, What We Don’t Know About Spreadsheet Errors Today (arXiv).
In contrast, cloud dashboards consume structured transactions directly from the WMS, standardise definitions, and support near real?time exception views. Leaders get consistent metrics across clients and sites and can export data to BI tools without re?keying.
Why Teams Struggle with Reporting
- Fragmented systems create gaps in KPI tracking and reconciliation
- Manual forecasting increases error and delays during volatile periods
- Weak exception design hides shrinkage until after service misses
- Limited automation slows turnover benchmarking and continuous improvement
Industry surveys show investment is tilting toward the tools that address these pain points, with MHI reporting stronger budgets for analytics and cloud capabilities in 2024, see 2024 MHI Annual Industry Report, The Collaborative Supply Chain.
How Does WMS Handle Reporting?
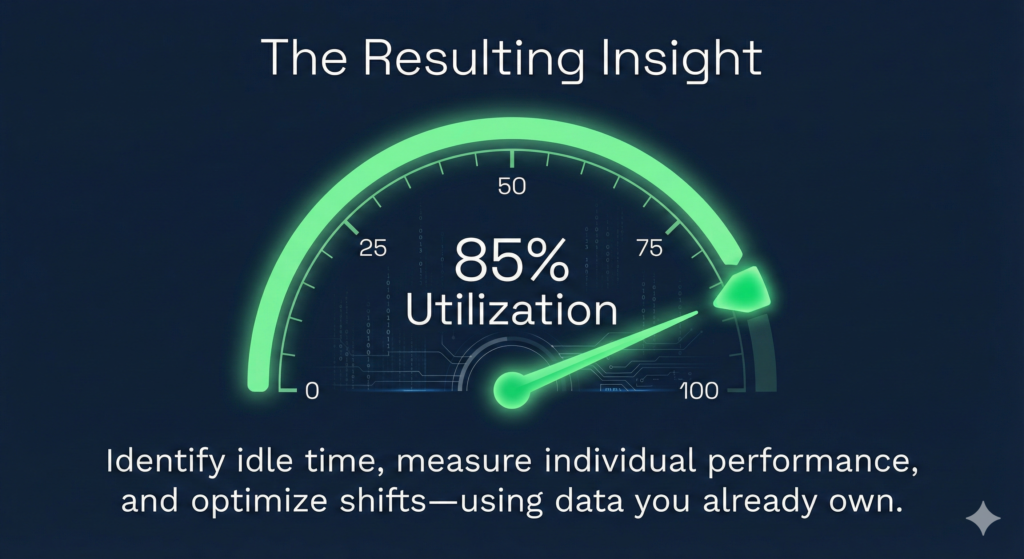
Clarus WMS captures transactions at the moment of work to provide real?time visibility across receipts, putaways, picks, moves, and adjustments, then surfaces exceptions for action. In practice, customers complement dashboards with BI tools where needed, for example blending tasks with shift calendars to assess labour utilisation.
Example: Interspan adopted Clarus WMS to streamline workflows and automate compliance reporting and saw reporting time fall by as much as 90% once process changes and automation were in place. Read the case study:Interspan customer story, Clarus WMS.
Real?Time Monitoring
Dashboards should show what is coming, what is happening, and what should have happened so leaders can confirm they have sufficient hours to complete the day’s work. Clarus’ transactional grids record who did what, where, and when, enabling immediate investigation and export for deeper analysis.
Scalable Adaptation
As order volumes and client mixes change, modular dashboards allow additional KPIs and exception rules without re?engineering the core. This supports consistent benchmarking at the site and network level and reduces the effort to onboard new customers.
Full Visibility
End?to?end traceability, from receipt to dispatch, reduces disputes and supports billing accuracy. Comparing expected versus actual times and quantities highlights controllable delays and supplier?related issues so teams can correct processes or terms and recover costs.
Ready to See It in Action?
Implementing advanced KPI reporting can transform performance by improving visibility and reducing avoidable cost. Envision dashboards that align analytics with operational needs, without the usual hurdles. Contact Clarus WMS for a demo to explore these benefits.
References
- MIT Center for Transportation and Logistics report, “The Warehouse of the Future”
- MHI, “2024 MHI Annual Industry Report, The Collaborative Supply Chain”
- Raymond Panko paper, “What We Don’t Know About Spreadsheet Errors Today (arXiv)”
- Clarus WMS customer story, “Interspan to Cut Reporting Time by 90%!”